Skip to content
CdnMD

Residency in Brandon, Manitoba

3 programs list Brandon as where they train in 2027: 2 in the R-1 match and 1 in the FM/ES match, at 1 school. They state 13 positions in all.

  • 51,313

    Population, 2021

  • about 2 h 45 min

    Drive to a city of 100,000+

  • about 10 min drive

    Airport with scheduled flights

  • 8 h 06 min to 16 h 21 min

    Shortest and longest day

3 programs in 2027 · 2 R-1 · 1 FM/ES · 1 school

See the programs
Key numbers for Brandon

Winter

−16.7 °CJanuary mean8 h 06 mindaylight on 21 Dec

53.3 days a year below −20 °C · 128 cm of snow a year

Daily means, 1991–2020 normals, Brandon, 7.4 km away.

Notice: 30 or more days a year below −20 °C.

Summer

18.4 °CJuly mean16 h 21 mindaylight on 21 Jun

Daily means, 1991–2020 normals, Brandon, 7.4 km away.

Drive to a city of 100,000+

about 2 h 45 minby road

To Winnipeg, 214 km. A free-flow estimate: no traffic, weather or ferry waits.

Airport with scheduled flights

about 10 minby road

To Brandon Municipal Airport (YBR), 7.4 km away in a straight line.

Rent vs PGY-1 pay

not published for this area

CMHC’s rent survey has no one-bedroom figure for an area that names only Brandon. Ask the program or the school about housing.

Ochre marks a figure past a fixed line below, and nothing else. Places are not compared with each other.

The lines: under 8 h of daylight on 21 Dec; 17 h or more on 21 Jun; 30 or more days a year below −20 °C; 4 h or more by road to a city of 100,000+; 90 min or more by road to the airport; rent at 30% or more of gross PGY-1 pay.

Programs in Brandon

2027 programs whose location label names Brandon, grouped by match, disciplines A to Z.

R-1 match 2 programs

Enhanced skills (FM/ES) 1 program

Hospitals in Brandon

Hospitals here whose clinical record system an official source states, A to Z. This is not a list of every hospital in Brandon: one that isn’t shown has no official statement we could find, which says nothing about its system. It describes the hospital, not any program.

  • Brandon Regional Health Centre

    Clinical record
    Altera Digital Health (EPR), moving to a new system in every hospital by 31 Mar 2027; this hospital’s own date is not published by the province yet As of 31 Oct 2026

Manitoba's electronic patient record is going into every hospital by the end of March 2027, a hospital at a time (6 of 57 complete as of June 2026). Order entry is not included at this stage. As of 31 Oct 2026

Verify with the official source: each source button opens the publisher’s own page.

Living in Brandon

Public statistics for this place, each with its source and reference period. They describe the place, not any program. Check each source before you rely on it.

More photos
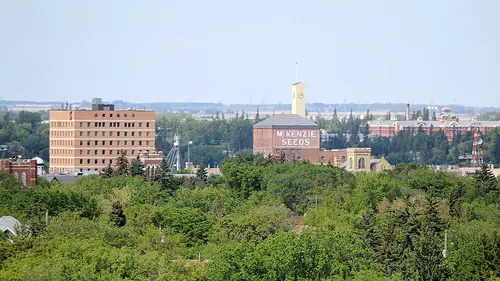
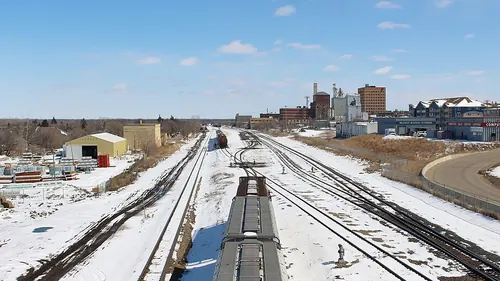
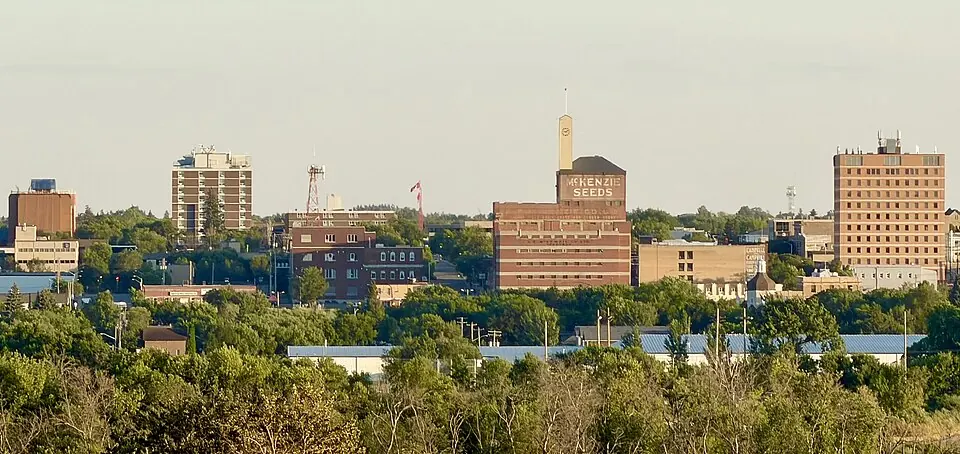
Photos of Brandon from Wikimedia Commons, openly licensed and credited under each. They show the place, not the program.

Where it is and getting around

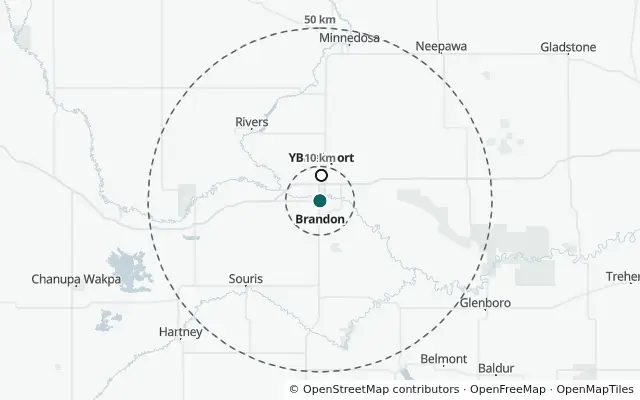
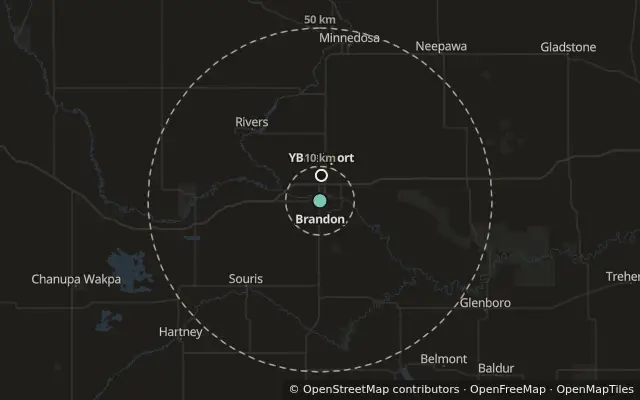
Map of the area around Brandon, with dashed rings 10 km and 50 km from the centre and the airport YBR marked.

The dashed rings are 10 km and 50 km from the centre of the place. This is a picture, not a live map.

Nearest airport with scheduled flights: YBR, 7.4 km away in a straight line.

Open on the map (the map page, with this province selected)

Drive times are free-flow estimates on roads from OpenStreetMap (© OpenStreetMap contributors, ODbL), rounded: no traffic, weather or ferry waits.

Nearest population centre of 100,000 or more
Winnipeg had 758,515 people in 2021 202 km in a straight line.
Nearest airport with scheduled flights
9.2 km by road Scheduled service as listed by OurAirports; check the airport for current routes.

Weather and daylight

Average temperature, °C

Average temperature by month: −16.7 °C in January, 18.4 °C in JulyMonthly mean temperature, January to December, in degrees Celsius: −16.7, −14.1, −7.0, 3.1, 10.3, 16.2, 18.4, 17.7, 12.2, 4.0, −5.3, −13.6. Year: 2.1.−20°−10°0°10°20°−16.7°JFMAMJ18.4°JASOND

Daily mean, 1991–2020 normals at Brandon, 7.4 km away.

Show the numbers: Monthly climate normals, 1991–2020, from Brandon
Monthly climate normals, 1991–2020, from Brandon
MonthAverage temperature (°C)Snowfall (cm)Days below −20 °C
January−16.724.717.2
February−14.116.614.0
March−7.019.26.1
April3.18.40.1
May10.34.10.0
June16.20.00.0
July18.40.00.0
August17.70.00.0
September12.20.10.0
October4.06.00.1
November−5.320.53.3
December−13.628.712.6
Whole year2.1128.253.3

Hours of daylight

Hours of daylight by month: 8 h 08 min in December, 16 h 19 min in JuneSunrise to sunset on the 15th of each month, in hours: 8.5, 10.1, 11.8, 13.7, 15.4, 16.3, 16.0, 14.5, 12.7, 10.9, 9.1, 8.1. Jun: 16 h 19 min. Dec: 8 h 08 min.0.0 h6.0 h12.0 h18.0 h24.0 hFebAprJunAugOctDec16 h 19 min8 h 08 min8.1 h

Sunrise to sunset on the 15th of each month, computed from the latitude (49.84° N). Hills and cloud are not counted.

Show the numbers: Daylight, sunrise to sunset, computed from latitude
Daylight, sunrise to sunset, computed from latitude
DayDaylight
January 158 h 32 min
February 1510 h 04 min
March 1511 h 47 min
April 1513 h 42 min
May 1515 h 21 min
June 1516 h 19 min
July 1515 h 58 min
August 1514 h 32 min
September 1512 h 42 min
October 1510 h 52 min
November 159 h 07 min
December 158 h 08 min
21 Dec, shortest day8 h 06 min
21 Jun, longest day16 h 21 min

Things to do nearby

Places mapped in OpenStreetMap within a set distance of the town centre. A count, not a rating.

In town, within 10 km

  • 35parks
  • 78playgrounds
  • 7ice rinks
  • none mappedfor swimming pools with a name
  • none mappedfor climbing places
  • 1library
  • 2museums
  • 4theatres
  • 3cinemas
  • 1arts centre
  • none mappedfor music venues
  • none mappedfor markets

Outdoors, within 50 km

  • 12protected areas with a name
  • 11nature reserves with a name
  • 22lakes with a name
  • 6beaches
  • 10campsites
  • none mappedfor ski areas
  • 13golf courses

Protected and conserved areas on the official list within 50 km: 13.

No mapped ski area within 150 km.

On foot and by bike, within 25 km

  • 300 kmof footpaths
  • none mappedfor signed hiking and bike routes

Lengths of mapped paths and signed routes follow how much has been mapped locally more than how much trail there is.

Map data from OpenStreetMap (opens in a new tab), available under the Open Database License (opens in a new tab).

People

2021 Census. Figures are for the municipality of Brandon, not the metropolitan area. Statistics Canada rounds counts, so small places are approximate.

Age

Median age 36.8. People aged 20 to 39: 30.0%.

  • 0 to 14 18.3%
  • 15 to 64 65.3%
  • 65 and over 16.4%

Municipality of Brandon, 2021 Census.

Show the numbers: Age of residents, 2021 Census
Age of residents, 2021 Census
Age groupShare of residents
0 to 1418.3%
15 to 6465.3%
65 and over16.4%
20 to 39 (inside 15 to 64)30.0%
Median age36.8 years

Official languages people can speak

  • English only 92.9%
  • English and French 4.8%
  • French only 0.0%
  • Neither 2.2%

Share of residents who can conduct a conversation in each. Not the language spoken at home.

Show the numbers: Official languages residents can speak, 2021 Census
Official languages residents can speak, 2021 Census
Can speakShare of residents
English only92.9%
English and French4.8%
French only0.0%
Neither2.2%
Immigrants
18.1% of residents arrived 2016–2021: 5.5% · non-permanent residents: 2.3%
Indigenous identity
14.2% of residents
How people commute
car, truck or van 89.9% · public transit 3.5% · walking or cycling 5.6% · other 1.1% Average commute: 14.6 minutes. Shares are of people who commute.The way Canadians commute was altered in 2021 by the pandemic, with lockdowns to slow the spread of COVID-19 and changes in how and where Canadians worked leading to 2.8 million fewer commuters, compared with five years earlier. Statistics Canada, The Daily, 30 Nov 2022(opens in a new tab)
Median household income
$76,000 before tax $66,000 after tax · income year 2020, in 2020 dollars

Rural context, housing and work

Each figure names the area it covers. A missing line means the source publishes nothing for this area. These describe the place, not every site a program trains in.

Population centre
Brandon, a medium population centre (30,000 to 99,999 people) 50,532 people in 2021
Remoteness index
0.329 0 is least remote, 1 is most remote. Statistics Canada calls this index experimental.
Basic cost of living
$53,331 a year Market Basket Measure 2025, Brandon, Manitoba, for two adults with two children. A modest, basic basket (the poverty line), not a resident’s budget. A size-class region is not the town itself.

Sources and licences

  • Contains information licensed under the Open Government Licence - Canada. Adapted from Statistics Canada, 2021 Census Cartographic Boundary Files.
  • Computed from latitude.
  • Source: Environment and Climate Change Canada, Canadian Protected and Conserved Areas Database (December 2025). Contains information licensed under the Open Government Licence - Canada.
  • Data Source: Environment and Climate Change Canada (Canadian Climate Normals 1991-2020).
  • Adapted from Statistics Canada, Index of Remoteness (17-26-0001), 2021. This does not constitute an endorsement by Statistics Canada of this product.
  • Adapted from Statistics Canada, 2021 Census of Population, table 98-10-0011-01, and the 2021 Census Cartographic Boundary Files. This does not constitute an endorsement by Statistics Canada of this product. Contains information licensed under the Open Government Licence - Canada.
  • Adapted from Statistics Canada, Table 11-10-0066-01 Market Basket Measure (MBM) thresholds for the reference family by Market Basket Measure region, component and base year, 2025. This does not constitute an endorsement by Statistics Canada of this product.
  • Map data from OpenStreetMap (https://www.openstreetmap.org/copyright), available under the Open Database License (ODbL).
  • Drive times computed from OpenStreetMap road data, © OpenStreetMap contributors (ODbL).
  • Airport data from OurAirports (public domain).
  • Adapted from Statistics Canada, Table 98-10-0011-01 Population and dwelling counts: Canada and population centres, 2021 Census. This does not constitute an endorsement by Statistics Canada of this product.
  • Adapted from Statistics Canada, 2021 Census of Population, table 98-10-0022-01. This does not constitute an endorsement by Statistics Canada of this product.
  • Adapted from Statistics Canada, Table 98-10-0002-01 Population and dwelling counts: Canada and census subdivisions (municipalities), 2021 Census. This does not constitute an endorsement by Statistics Canada of this product.
  • Adapted from Statistics Canada, Table 98-10-0057-01 Household income statistics by household type: Canada, provinces and territories, census divisions and census subdivisions, 2021 Census. This does not constitute an endorsement by Statistics Canada of this product.
  • Adapted from Statistics Canada, Table 98-10-0173-01 Mother tongue by knowledge of official languages: Canada, provinces and territories, census divisions and census subdivisions, 2021 Census. This does not constitute an endorsement by Statistics Canada of this product.
  • Adapted from Statistics Canada, Table 98-10-0266-01 Indigenous identity by Registered or Treaty Indian status: Canada, provinces and territories, census divisions and census subdivisions, 2021 Census. This does not constitute an endorsement by Statistics Canada of this product.
  • Adapted from Statistics Canada, Table 98-10-0307-01 Immigrant status and period of immigration by place of birth: Canada, provinces and territories, census divisions and census subdivisions, 2021 Census. This does not constitute an endorsement by Statistics Canada of this product.
  • Adapted from Statistics Canada, Table 98-10-0458-01 Main mode of commuting by commuting duration, time leaving for work, age and gender: Canada, provinces and territories, census divisions and census subdivisions, 2021 Census. This does not constitute an endorsement by Statistics Canada of this product.
  • Photographs: Wikimedia Commons. Each photo is credited under it with its author and licence (CC0, CC BY, CC BY-SA or public domain). Resized and re-encoded as WebP; not cropped.
  • Map data from OpenStreetMap (https://www.openstreetmap.org/copyright), available under the Open Database License (ODbL).
  • Map images drawn from OpenFreeMap tiles (https://openfreemap.org), © OpenMapTiles (https://openmaptiles.org).
  • Airport data from OurAirports (public domain).

Across Manitoba

A page for each specialty trained in Brandon lists its programs across Manitoba, school by school.

Nearby places

Places with a page within 300 km of Brandon in a straight line, nearest first; not a driving distance.

Other places in Manitoba 5

Places with a page, A to Z.

A program’s streams share one row, and a quota two of its streams both state is counted once in the totals. Positions are the quotas each program page states; a program that states none is not counted as zero. CdnMD is independent of CaRMS: confirm everything on carms.ca (opens in a new tab).